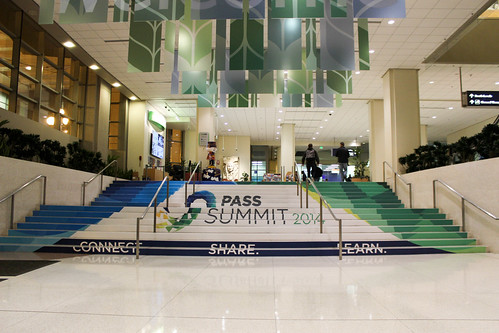
I went to the SQL Server PASS Summit 2014 in Seattle, this is just my recap of my first day. My first day was day 2 of the pre-conference. My day started early, really early, the jet lag is killing me and I am up by 2 AM tossing and turning. By 5 I was already done with my workout, read 30 pages of the book Neuromancer and had showered.
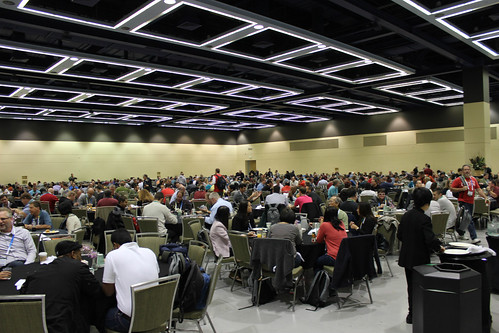
I met a co-worker and we walked to the Seattle conference center so that he could register and we could get some breakfast before the pre-conference sessions kicked off.. You can see a picture I took of all the people eating breakfast above
I attended the Troubleshoot Customer Performance Problems Like a Microsoft Engineer, this session was presented by Tim Chapman and Denzil Ribeiro, both of them work for Microsoft CSS
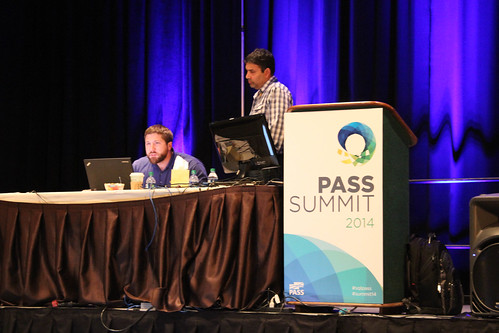
The session started at 8:30 AM and ended at 4:30, I took lots of notes and I have pasted them below as is, there are typos and some stuff might not make sense to you, but these are for me, and I will use these note to investigate and research the stuff I learned at this session. The reason I took all these notes is because the pre-conference sessions are not recorded and won't be on the PASS 2014 DVDs.
Scroll down to after the notes for more stuff about this day if you don't care about these notes
Diag manager
Choose 64 bit (AMD button)
Perfmon information..overhead is very low
Trace is collected by default... uncheck that... If you don't fin the info you want, you can go back and then run a trace as well
My_Colleectors..click on details an then enhance by picking what you need......
pssdiag.XML..change version to 12 in 3 different places change 10.5 (2008 R2) to 11 (SQL Server 2012) or 12 (SQL Server 2014)
Overhead is 1 to 3 percent if you are not running a trace. DOn't put the data collection files on the same drives as you SQL Server data files
SQL Nexus
-------
Modify rowset file if you want to add your own or if you want to supply columns names...SQL Nexus will figure out names by default... name = table name..identifies is th print statement in the collection files
WHERE %%LOCKRES%% = '(HashNumberHere)'
Windows OS = preemptive, SQL Server OS is non preemtive
---- After break
High signal wait time = CPU pressure
Buffer cache hit ratio is since restarted...if you have a problem in the last week but your server has been up for 6 months you might still be at 95% or higher thus masking the problem
sys.dm_io_virtual_file_stats.....stalls is what SQL Server sees, not what WIndows sees
Cost threshold of parallelism..... default = 5 ... For OLTP you might want to set it to maybe 30... better to use MAXDOP instead of Cost threshold of parallelism.. Version of SQL Server and NUMA plays a role..hardware changes significantly since they tested this last.
COmmon High stats
WRITELOG
When database changed are flushed to the transaction log file
CXPACKET
parralel queries are happening, not a good or bad thing, sometimes less desirable for OLTP
SOS_SCHEDULER_YIELD
When a thread voluntarily releases its hold on the scheduler to allow another thread to do its work. Not necessarily a problem unless it consumes a very high % of wait time on the system
PAGEIOLATCH_*
Latching a buffer structure to move a page to disk from memory, long waits may indicate a disk or memory issue
PAGELATCH_*
A task is waiting for a page latch not associated with an IO request, can be caused by inserts into the same page or contention on allocation pages
ASYNC_NETWORK_IO
Typically occurs because the client requestion data from SQL Server is not processing the request fast enough
OLEDB
Occurs when SQL Server calls the OLE DB provider. Often associated with 3rd paty tools that heavily call DMVs. Also can be caused by RPC, linked server calls, OpenQuery, OpenRowset or profiler
LCK_*
Waiting to acquire a lock
These are accumulated after the lock has been released
RESOURCE_SEMAPHOR
Waiting for memory grant due to a high number of concurrent queries or excessive memory grant requests. Not uncomment for data warehouse workloads
LATCH_*
When a latch is acquired on some non-buffer construct. Mostly internal uses - usually not a lot you can do about it
CMEMTHREAD
When a task is waiting for a thread-safe memory object, increases when multiple tasks try to allocate from the same memory object
tempdb
Can become a bottleneck if not properly sized/allocated. Faster drives are better
Tempdb is used a lot, for example
Temporary tables and table variables
Internal work tables (spools)
Spills (hash/sort/exchange)
Version Store
Make sure all files are equally sized upon creation
For # of files we recommend
<8 Cores = 8 tempdb files
>= cores = use 8 unless you still have latch contention, then add 4 at a time afterwards
Perfmon
Save the counters in a cfg file and then next time you open this file you will have all the counters available
Useful Memory Counters
SQL Server: Buffer Manager
Page Life Expectancy
Checkpoint Pages/Sec
Free Pages
Lazy Writes/Secgg
Memory Manager: Memory Grants Pending
Process: Working Set
Memory: Available MBytes
Useful Network Counters
Network Adapter: Current bandwith
Network Adapter: Bytes Total/sec
Network Adapter: Output Queue Length
Useful CPU Counters
Processor % Privileged Time
Processor % Processor Time
Process:*
SQL Statistics: Batch Requests/Sec
Database: Transaction/Sec
SQL Statistics: Compiles/Sec
Useful Process Counters
IO Data Bytes/sec
% Processor Time
Working Set
Useful IOCounters
Logical Disk (what SQL Server sees)
Physical Disk (What the OS sees)
Avg Disk Sec/Read
Avg Disk Write
% Idle Time
Disk Transfer/sec
Power Settings
Switch from balanced to high performance
Performance Dashboard Reports
Set of SSRS performance eports that integrate into SSMS, needs to be installed, download from CodePlex
------------------------------------------------------------------------------------------------------------
Denzil
------------------------------------------------------------------------------------------------------------
Why Xevents?
SQL trace not as performant, reduce need for a debugger, learn internals and troubleshoot, common instrumentation
Xevents: events, Predicates, Actions, Targets
Targets
Event file: async, disk Writes events from buffer to disk
ETW file: sync, disk Used to correlate with Windows or app data
Event counter: sync, memory Counts all specified events
Ring Buffer: async, memory event data held in FIFO
Histogram: async, memory Sums event occurances based on column or action
Pair matching: async, memory Determince when a specified paired event does not occur in a matched set
Demo of how to setup extended events with the wizard as well as T-SQL
Debug channel exposes some advanced things to help you better troubleshoot
Demo of using extended events to track on a per sessionid basis, this is not possible with DMVs
System Health Session
1)Errors
Any error with severity > 20
Memory related errors
CLR allocation and virtual allocation failures
2)Waits
lathes > 15 seconds
Locks > 30 seconds
preemtive waits > 15 seconds
3)Monitors
Deadlocks
sp_Server_diagnostics
4)Ring Buffer Data
COnnectivity Errors
Security Errors
Memory broker
Memory Node OOM
Scheduler Monitor
sp_server_diagnostic_component
If System Health Session is somehow disabled, it will not affect a cluster failover
Spinlocks
If the first acquire is unsuccessful a collision happens causing a spin. then we try again, during this phase we are spinning, we backoff and try again. You cn use spinlock_backoff and spinlock_backoff_warning, spinlock_backoff_warning happens when we have been spinning for a while and the thread got kicked off the CPU
traceflag 3656 + symbols makes callstacks readable instead of just Hex. Symbol files resolve memory into actual SQL Server calls, you can download the symbol list from Microsoft
Showed how Microsoft redesigned locks by using partition_id so locks were not in just one bucket and spinning decreased a lot, you can enable this by running SQL Server with trace flag 1236
Next up was a slide about problems with plans in the cache.
Cache limit is 160K..kb 2964518, I looked this up and here is what is in that kb article about plans
SQL service (Memory Manager) TF 8032 Entries in the plan cache are evicted because of growth in other caches or memory clerks. You might also encounter plan cache eviction when the cache has reached its maximum number of entries. In addition to this trace flag 8032, consider the optimize for ad hoc workloads server option and also the FORCED PARAMETERIZATION database option.
CMEMTHREAD
Creating a spatial index on a 3 billion row took 4 days, demo showed a smaller table and how it affected performance. Spinlocks wait was high, a lot of CMEMTHREAD wait types, spiking from1 CPU to another. After doing a DBCC STACKDUMP and then loading it in WinDbg, we could see that it was partitioned by node instead of CPU. When starting with trace flag T8048 performance was much better, all the waits vanished. The index creation went from 4 days to 5 hours after using trace flag T8048
The last part of the session was about Hekaton or better known by it's marketing term In-Memory OLTP. At least Denzil didn't say that to use Hekaton there are no application changes needed :-)
In-Memory OLTP is a good fit for
Performance-critical OLTP (think order processing or trading)
High data-input rate (nicknamed “Shock Absorber”)
In-Memory OLTP as components of ETL
Session state management
Read scale
In-Memory OLTP is not a good fit for
No permission for code changes
App depends on locking behavior
Full data warehousing
Long-running reporting workload (use Columnstore instead)
Use a lot of XML manipulation/Full-Text searches
Heavily parallelized query
Constrained on memory
******** END OF NOTES ****************************
All in all an excellent session, but man am I wiped out :-)
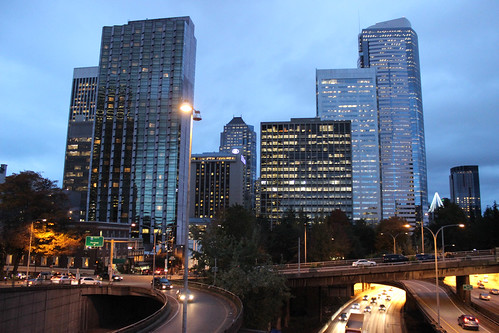
I went back to the hotel to drop off my laptop, it was actually dry for a change, not a raindrop in sight and about 55 degrees, a very pleasant evening. I had an hour to kill so I took some pics of Seattle, in the picture below you can see Pike Place Market, you can see all of my Seattle 2014 pictures here on flickr

When I got back to the Seattle convention center, the welcome reception started
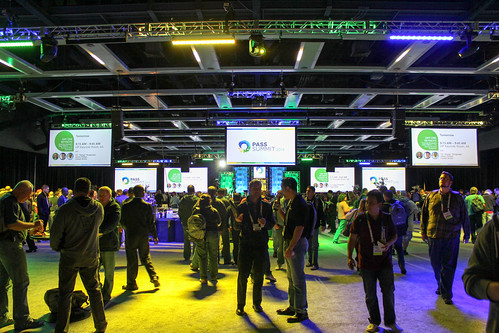
There were a ton of people at this reception, I saw a bunch of old friends and acquaintances.
I didn't stay that long because I had dinner plans with some MVPs (Adam Machanic, Davide Mauri, Marco Russo, Peter Myers and Alberto Ferrari). We went to a restaurant named Rione XIII, this restaurant is the only one that had burrata on the menu, the food was excellent, you can find the menu here: Rione XIII menu
After being up for over 21 hours I finally went to bed. Guess what, four hours later, I am awake again....writing this post...by the time I am used to this jet lag, it will be time to fly back to Princeton again
No comments:
Post a Comment