Monday, January 15, 2018

When uncompressing data, make sure to use the correct function


SQL Server has offered data compression for a while now, you could either use PAGE compression or ROW compression, you had no ability so specify which columns.  That changed in SQL Server 2016

SQL Server 2016 added the ability to compress data yourself by using the COMPRESS function. The COMPRESS function compresses the input expression using the GZIP algorithm. The result of the compression is byte array of type varbinary(max).


Let's take a quick look at how this function works

We will create a table, insert one row and then update the SomeOtherColumn value by using the COMPRESS function on the SomeColumn column

CREATE TABLE test (Somecolumn varchar(200), SomeOtherColumn varbinary(max))
go
INSERT test VALUES ('aaaaaaaaaaaaa', null)


UPDATE test
SET SomeOtherColumn = COMPRESS(Somecolumn)
go

SELECT Somecolumn,SomeOtherColumn 
FROM test

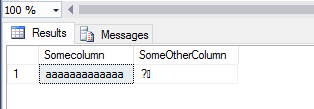
Here is what the output looks like


What if if told you now to create a new table by uncompressing the data via a SELECT INTO query followed by dropping the old table

No problem, if there is a COMPRESS function then surely there must be an UNCOMPRESS function... right?  Let's find out......


SELECT Somecolumn,CAST( UNCOMPRESS(SomeOtherColumn) AS varchar(max))  AS SomeOtherColumn
INTO SomeNewTable
FROM test

DROP TABLE test

SELECT *
FROM SomeNewTable


Wrong, while the UNCOMPRESS function exists, it is not the correct function

Hopefully you ran a test before just dropping a table after doing select into

The correct function is DECOMPRESS

Here is what it all looks like

SELECT Somecolumn,SomeOtherColumn,
 CAST( DECOMPRESS(SomeOtherColumn) AS varchar(max)) AS CastedDecompressed,
 DECOMPRESS(SomeOtherColumn) as Decompressed FROM test

 SELECT Somecolumn,SomeOtherColumn, 
CAST( UNCOMPRESS(SomeOtherColumn) AS varchar(max)) AS CastedUncompressed,
 UNCOMPRESS(SomeOtherColumn) as Uncompressed FROM test

This is the output


As you can see the UNCOMPRESS function returns a bunch of nonsense while the DECOMPRESS function works as expected

So the question is really wth is the uncompress function?


Friday, December 29, 2017

The 15 most popular posts in 2017


Another year is almost over. As the last post of this year I decided to share with you the 15 most popular posts in 2017. I just used Google Analytics to grab this info, I excluded the home page from the top 15.  Some of these post are so old, we didn't even have windowing functions in SQL Server when these were written.,....

Here they are in order of popularity

01. Ten SQL Server Functions That You Hardly Use But Should
A post from 2007 showing some hardly used functions like NULLIF, PARSENAME and STUFF

02. Five Ways To Return Values From Stored Procedures
A very old post that shows you five ways to return values from a stored proc

03. Your lack of constraints is disturbing
A post showing the type of constraints available in SQL Server with examples

04.  Use T-SQL to create caveman graphs
One of the shortest post on this site, show you how you can make visually appealing output with a pipe symbol

05. Convert Millisecond To "hh:mm:ss" Format
A very old post showing you how to convert from milliseconds to "hh:mm:ss" format

06. T-SQL Tuesday #92, Lessons learned the hard way
Some of my mistakes put together in 1 post

07. SQL Server 2017: SQL Graph
Me messing around with the Graph functionality in SQL Server 2017

08. Query Analyzer Trick
A very old post explaining how you can drag the columns into the query window from object explorer. I think by now everyone knows this one right?

09. ISO-11179 Naming Conventions
A very old post linking to the ISO-11179 Naming Conventions document

10. Not sure that I like the message from Online Resumable Index Rebuild in SQL Server 2017
After playing qround with resumable index rebuilds I think the kill state and severe error occurred is a little over the top

11. Some cool SQL Server announcements SQL Graph, Adaptive Query Plan, CTP1 of SQL vNext, SQL Injection detection
This is my recap of the chalkboard session with the SQL Server team at the SQL Server PASS summit in Seattle.

12.  Five great SQL Server GitHub repos that every SQL Server person should check out
What the titles says, 5 GitHub repos you need to use

13. Chaos Isolation Level In SQL Server
This is linked from  dba.stackexchange.com, it is kind of interesting because it was a silly post I made

14. T-SQL Tuesday #86: String or binary data would be truncated
A pet peeve of many people

15. Microsoft releases SQL Server Horizontica, a Vertica killer
Probably the best version of SQL Server ever created, was only available for download for 24 hours.


That is all for this year... see you in 2018...  the year of Linux on the desktop, DevOps, Ethereum, AR/VR, bendable phones and much more......

Out of focus Christmas tree,

Wednesday, November 29, 2017

Use T-SQL to create caveman graphs


I found this technique on Rich Benner's SQL Server Blog: Visualising the Marvel Cinematic Universe in T-SQL and decided to play around with it after someone asked me to give him the sizes of all databases on a development instance of SQL Server

The way it works is that you take the size of the database and then divide that number against the total size of all databases. You then use the replicate function with the | (pipe) character to generate the 'graph'  so 8% will look like this ||||||||

You can use this for tables with most rows, a count per state etc etc. By looking at the output the graph column adds a nice visual effect to it IMHO


Here is what the final query looks like


SELECT 
       database_name = DB_NAME(database_id) 
     , total_size_GB = CAST(SUM(size) * 8. / 1024/1024 AS DECIMAL(30,2))
  , percent_size = (CONVERT(decimal(30,4),(SUM(size) /
     (SELECT SUM(CONVERT(decimal(30,4),size))  
     FROM sys.master_files WITH(NOWAIT)))) *100.00)
  , graph = replicate('|',((convert(decimal(30,2),(SUM(size) / 
    (SELECT SUM(CONVERT(decimal(30,2),size))  
     FROM sys.master_files WITH(NOWAIT)))) *100)))
FROM sys.master_files WITH(NOWAIT)
GROUP BY database_id
ORDER BY 3 DESC

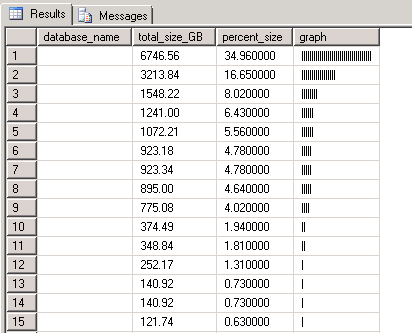
And here is the output (I blanked out the DB name in the output below), there are 48 databases, 15 of them show a bar, the rest don't because they use less than 0.5% of space.


Do you see how you can quickly tell visually that the top DB is about twice as large as the next DB? 

Those guys in Lascaux would have been so proud, only if they could see this  :-)